Region-by-region view
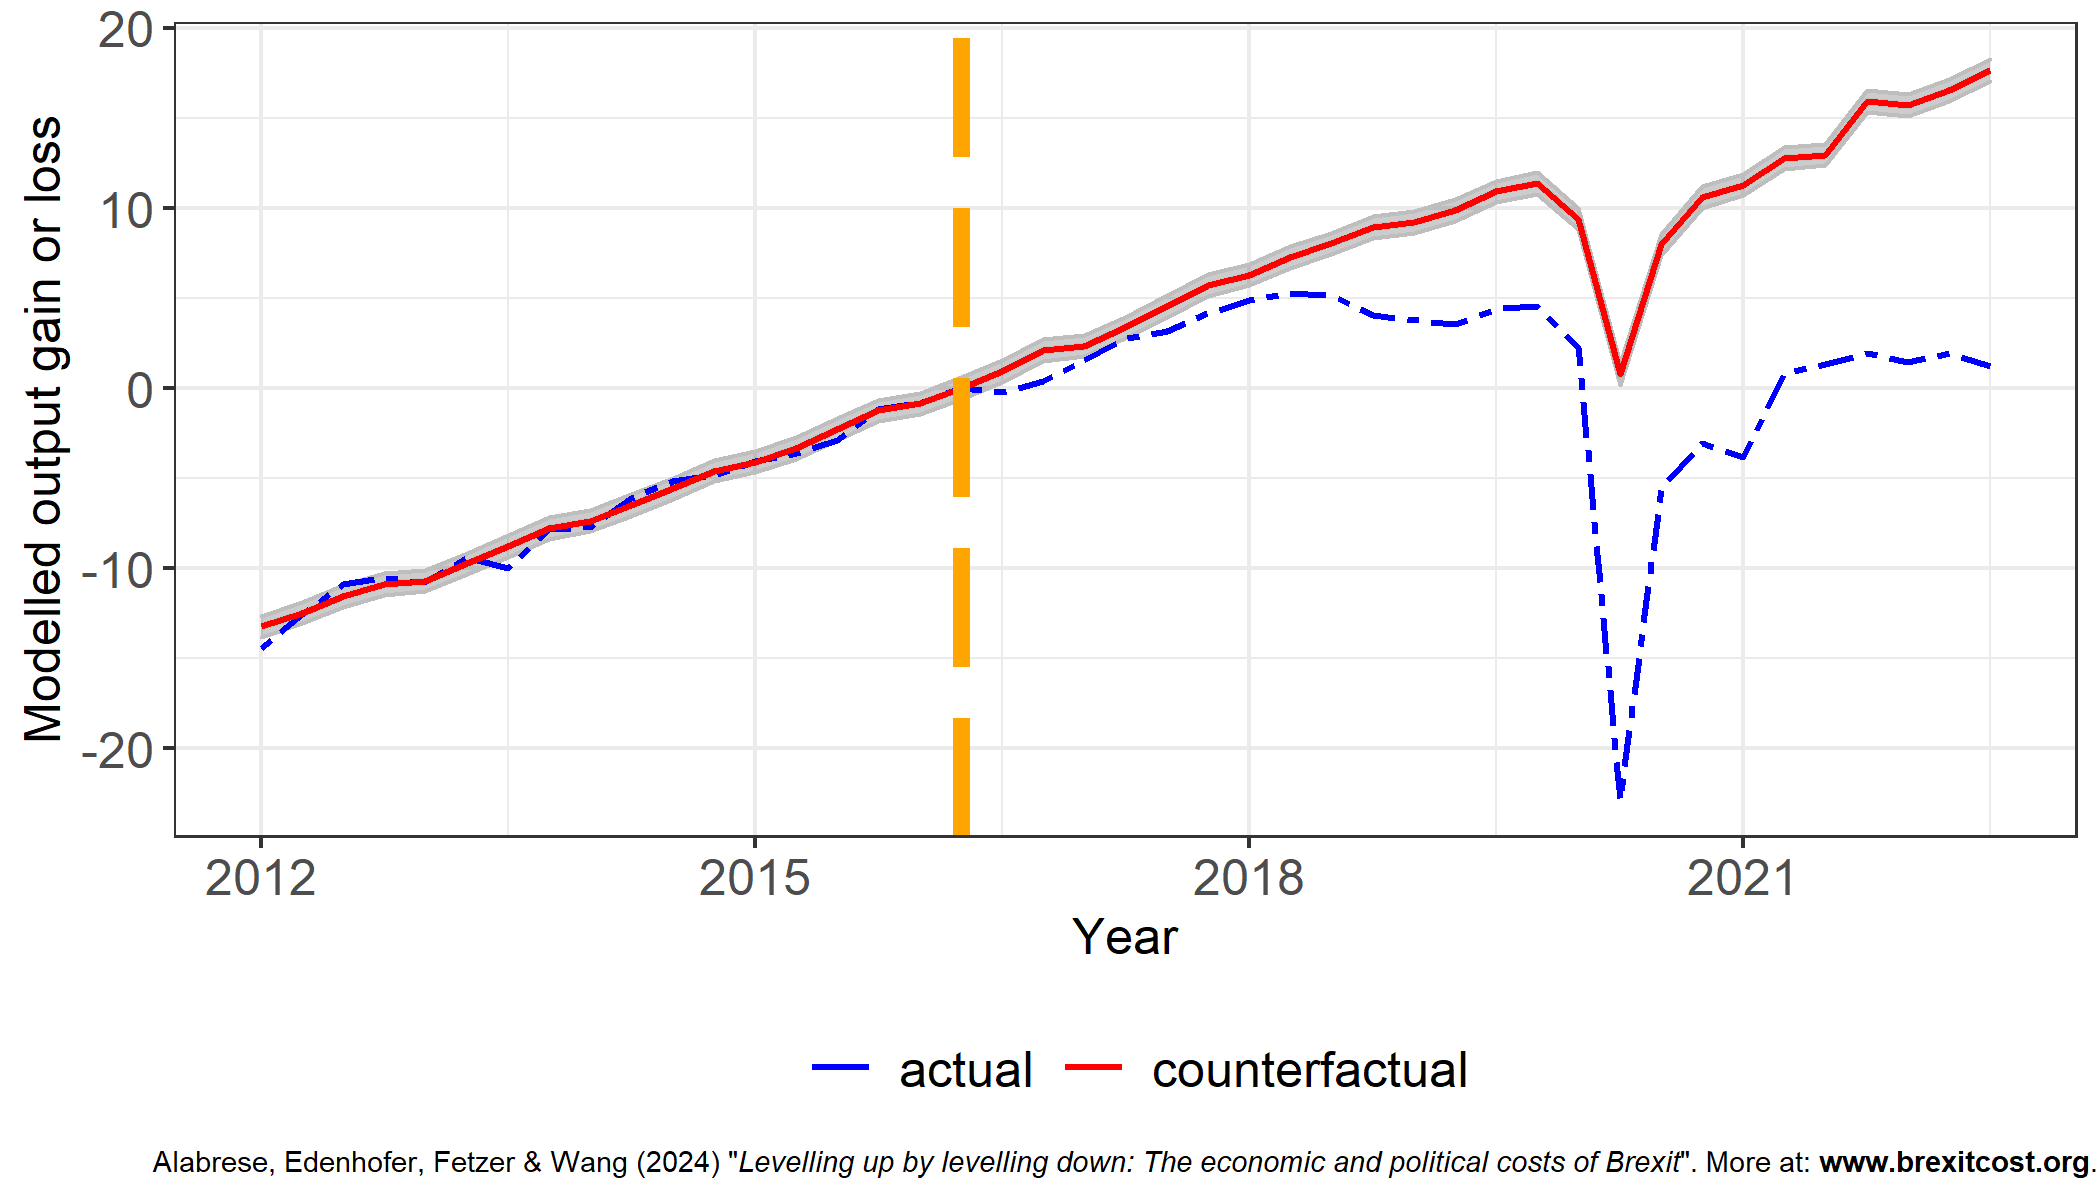
In the below you can select each individual region to visually represent the economic impact of Brexit estimate one by one. The figure that is plotted plots the synthetic control estimate of gross-value added in a region against the actually measured estimate.
Select a region:

Estimates for 2022 by region
Below table provides the estimated cost of Brexit in the year 2022 for each of the UK's region evaluated for the year 2022. The numbers are in millions of pounds. With the exception of Northern Ireland, Brexit appears to afford an economic cost on all of the UK's regions. The costs are, however, in absolute terms largest in London.| Code | Region | MAPE | RAPE | RMSPE | Ensemble (avg) | Ensemble (sim) |
|---|---|---|---|---|---|---|
| Different model estimates | ||||||
| TLC | North East | -3194.32 | -2940.53 | -3474.91 | -2726.94 | -2744.40 |
| TLD | North West | -12765.79 | -10581.69 | -12765.79 | -8448.46 | -8287.94 |
| TLE | Yorkshire and The Humber | -6313.50 | -6313.50 | -6313.50 | -4056.28 | -4158.12 |
| TLF | East Midlands | -7706.56 | -7706.56 | -7706.40 | -4853.91 | -4808.15 |
| TLG | West Midlands | -10608.99 | -11193.41 | -11193.41 | -10644.51 | -10555.65 |
| TLH | East | -6558.22 | -7409.15 | -7219.12 | -6515.81 | -6535.31 |
| TLI | London | -34565.20 | -27142.56 | -30223.62 | -29509.78 | -29359.54 |
| TLJ | South East | -13114.79 | -11830.85 | -13114.79 | -10964.41 | -10959.99 |
| TLK | South West | -7699.56 | -8026.85 | -7699.56 | -6399.07 | -6365.60 |
| TLL | Wales | -3880.17 | -3938.11 | -3938.08 | -3219.73 | -3210.27 |
| TLM | Scotland | -9606.02 | -9828.46 | -9606.02 | -8640.00 | -8592.67 |
| TLN | Northern Ireland | -723.54 | -723.54 | -723.54 | -569.13 | -604.09 |
